A leading Turkish news publisherAnonymised at the client’s request
+370% programmatic revenue in four months, with the direct-sales strategy untouched.
A leading Turkish news publisher · four-month engagement · reported by APH from the engagement
Service line: Programmatic monetization through APH — ad units, price floors, deals, the video player and the supply path, rebuilt around one fixed point.
Published Last updated
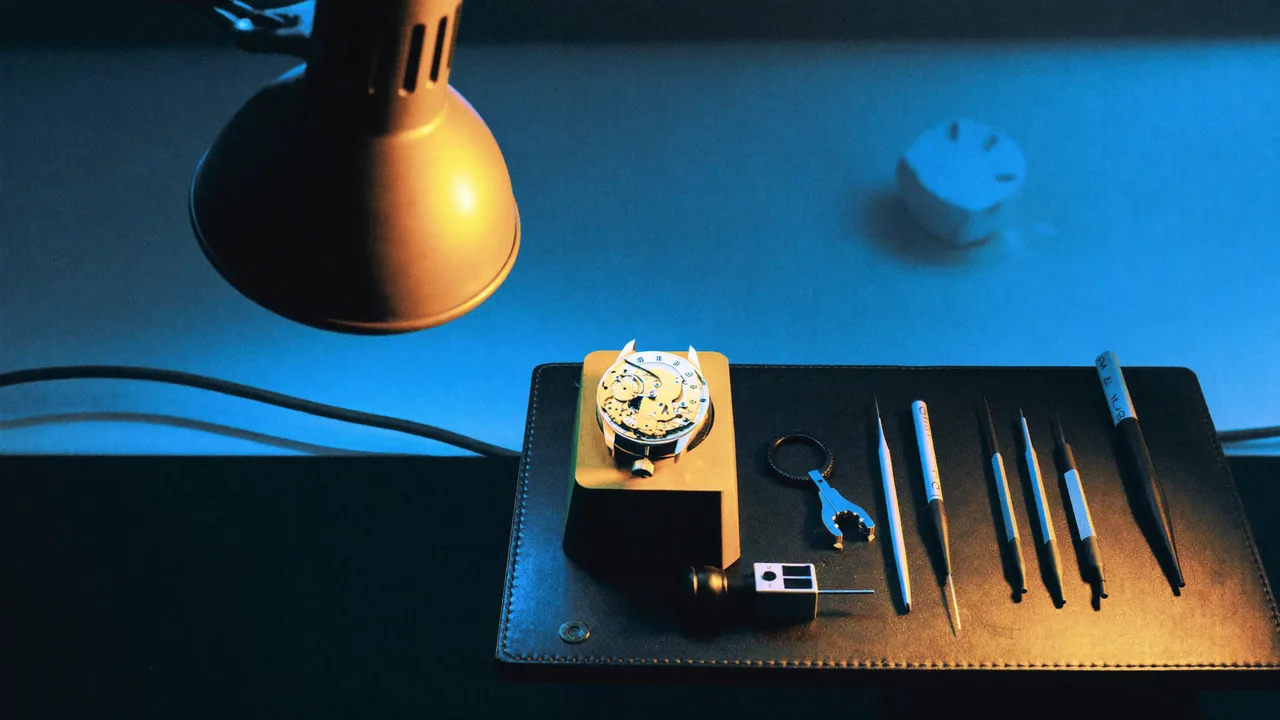
A watchmaker’s bench. Every part regulated and measured, one at a time; the case it all sits in never changed.Key results · reported by APH from the engagement
+370%Programmatic revenueFour months, start to resultIndexed to the starting month · APH ad-server reporting
+80%Video revenueAfter the player swapAgainst the old player, same inventory
4Months, start to resultThe whole engagementSix interventions, in sequence
1Fixed pointThroughoutThe inventory strategy, which never moved
At a glance
Client
A leading Turkish news publisher Anonymised at the client’s request
Sector
News media Corporate, established · a direct-sales house
Market
Türkiye
Engine
Google Ad Manager programmatic Ad units, price floors, deals, video player, supply path
APH role
Programmatic monetization partner Six interventions, one fixed point
Engagement and source
Four-month engagement APH ad-server reporting for the client · client anonymised
The 60-second version
Three sentences that can be read aloud in a meeting.
Situation
A leading Turkish news publisher — corporate, established, built around direct sales — treated programmatic as an afterthought: generic ad tags, one-size-fits-all placements, floors set once and forgotten, and a page cluttered with partners that added latency but little revenue.
What APH did
They kept their inventory strategy, the one fixed point; everything else we challenged. Category-specific ad units, floor science, programmatic deals, a video player swap, partner pruning, and placements re-set inside a broader website redesign.
What changed
Programmatic revenue rose 370% in four months, indexed to the starting month, and the new video player outperformed the old one by more than 80% on video revenue — with the direct-sales strategy untouched throughout.
The client is anonymised at their request. Everything else on this page — the work and the result — is reported by APH from its own ad-server reporting for the engagement; absolute revenue is withheld and shown as an index.
Exhibit 1 · reported by APHProgrammatic revenue, starting month against month four.Reported by APH from ad-server reporting for the engagement. Indexed to the starting month (100); absolute revenue withheld. Client anonymised at their request.
What we walked into01The starting point
A leading Turkish news publisher — corporate, established, and built around direct sales. The sales house was the business, and it worked. Programmatic was what happened to the impressions direct did not sell: generic ad tags, one-size-fits-all placements, floors set once and forgotten, and a page cluttered with partners that added latency but little revenue.
None of that was a decision anyone had made. It was the residue of decisions nobody had revisited, and each one cost something on every impression the house served.
What we agreed02The deal
They kept their overall inventory strategy — that was the one fixed point. Everything else, we challenged. That deal is what made the engagement possible: a direct-sales house will not let a programmatic partner touch the thing it sells, and it should not have to. With the strategy off the table, the rest of the stack was open to be tested, measured and re-set.
Partners pruned, paths re-routed. Every connection that stayed had to pay its way on the impressions it touched.
What we did03The work
Six interventions over four months, in sequence. No dates are attached to the steps; the order is the point.
01
UnitsCategory-specific ad units
Homepage, sports and daily news each got their own units instead of one generic tag, so demand could price what it was actually buying.
02
FloorsFloor science
Significant price-floor optimization across the restructured units — floors set from what the auction was paying, unit by unit, rather than once for the whole site.
03
DealsProgrammatic deals
Worked directly with management to bring deals into a house that had never prioritized them.
04
VideoA video player swap
The replacement outperformed the old player by more than 80% on video revenue, on the same inventory.
05
PartnersPartner pruning
Programmatic partners that cluttered the page without paying their way were cut.
06
PlacementPlacement and design
Ad slots repositioned as part of a broader website redesign collaboration.
The fixed point
The inventory strategy never moved. Every one of the six steps was measured against the same direct-sales-first setup it started with, which is what makes the result attributable to the programmatic work and not to a change in what the house sold.
What happened04The result
Programmatic revenue rose 370% in four months. Not from one silver bullet — from a dozen unglamorous decisions, each measured. Indexed to the starting month at 100, month four came in at 470. Absolute revenue is withheld at the client’s request.
Exhibit 1 · reported by APHProgrammatic revenue, starting month against month four.Two bars on a zero axis: the month the engagement began, set to 100, and the fourth month.Reported by APH from ad-server reporting for the engagement. Indexed to the starting month (100); absolute revenue withheld. Client anonymised at their request.
The index hides the currency and keeps the shape. The starting month is 100; month four is 470, which is the 370% rise. The months between are not drawn because the six interventions overlapped and the monthly series would suggest a precision about which step did what that the data does not support.
Exhibit 2 · what changed, in orderSix interventions, in sequence.The order the work ran in, from the units that let demand price the page to the redesign that repositioned the slots.Ordinal: the strip shows sequence, not dates or duration, and no step is weighted by its share of the result. The fixed point sits underneath because it applied throughout.
Units came first because floors on a generic tag are floors on nothing in particular. Deals, the player swap and the pruning followed once there were units to sell, and the redesign fixed the positions last.
Exhibit 3 · the player swapVideo revenue, old player against new.The same inventory through two players; the old one indexed to 100.Indexed, reported: old player 100, new player 180, from the “more than 80%” outperformance APH measured on the same inventory. Drawn at 180; the reported figure is a floor, not a point.
The player swap is the one step with its own number. On the same inventory the replacement returned more than 80% more video revenue than the player it replaced — drawn here as 100 against 180, the lower bound of what was reported.
How to read the numbers05Methodology and caveats
Data source
APH’s ad-server reporting for the client, from the engagement. These are APH’s own measurements; no third party has audited them.
Metric
Programmatic revenue, indexed. Absolute revenue is withheld at the client’s request; the starting month is set to 100 and month four is 470. Video revenue is indexed the same way, old player at 100.
Window
Four months, from the month the engagement began to the fourth month. The engagement period is not dated on this page.
Comparison basis
Month four against the starting month, same property, same inventory strategy. The player swap is the new player against the old on the same inventory. Neither is a holdout or a year-on-year comparison.
Seasonality
Not adjusted. News traffic and ad demand move through the year, and a four-month window will carry some of that. The figures are as reported, not seasonally corrected.
Results will vary
This is one publisher’s result. Results depend on the starting stack, the traffic mix and the direct-sales setup, and we cannot guarantee the same outcome for another property. The client is anonymised at their request.
The pattern06What we do with this today
The relationship is historical, and the work has since become product. The floor discipline this engagement built by hand — floors set unit by unit from what the auction was actually paying — is what Archon Cortex now does twice a week from raw bid data, across every property we run. The rest of the sequence is the audit we start every publisher relationship with: units, floors, deals, video, supply path, placement, in that order.
Prepared by Archon Programmatic House · archonph.com/case-news-publisher-2026.html · Last updated 18 September 2026 · Reported by APH from ad-server reporting for the engagement · Client anonymised at their request
Start here
Every publisher relationship we have started with an audit.
We look at your floors, your supply paths and your identity setup, and come back with what we would change and what it is worth. No obligation, and a person reads it.